
MEGL ran a six project program with 36 participants between faculty, graduate research assistants, and undergraduate research interns. For project names and descriptions, please click the boxes below.
In addition to the research projects, MEGL ran an Outreach program, which exposed K-12 students to important mathematical concepts through visualizations and hands-on activities.
Data
We gathered a large amount of historical data on stock market prices, then used the data to test a variety of trading strategies. The following data were gathered:
· Dow Jones Industrail Average (“DJIA”) closing prices, for every trading day between December 31, 1912 and December 31, 2024.
· CPI measures, monthly, for the same time period
· Dividend yield rates for the S&P 500 companies, quarterly, for the same time period
Each person on the team used computer programming to investigate trading strategies that they created and determined to be worth investigation.
Background
One useful description of the stock market is that it is a casino with a long-term uptrend. That is, a casino where the player has the edge.
Philosophically, we have two camps:
1) The stock market is a Markov chain: history does not affect the probabilities of what might happen next
2) Past price trends can be analyzed and used to more accurately assess future price movements
If the latter is correct, then our investigations should not suggest that any particular strategy is more successful than any other.
As an example, consider the well-known strategy of “dollar-cost averaging”. With it, you would invest a constant amount $x, regularly spaced through time. When the market is low, you are automatically buying MORE shares than when the market is high.
Other strategies exist and will be investigated.
The team was creative in concocting strategies to test.
Processing
Our time period of study was Januay 1915 thru December 2024 (110 years). We had data for 1913 and 1914, but during 1914 the stock market was closed for 4 months because of the start of World War I.
Our variable of study was the DJIA adjusted for
· long-term uptrend removed
· inflation removed
· dividend yields included
We calculated the daily real return by fitting cubic splines to monthly data for the CPI and divident payout rates.
This gave us almost 30,000 daily rates of return.
We began with two statistical tests of whether the Dow was a Markov chain during the time period.
Wald-Wolfowitz runs test on daily data
Smoothness test (devised by the team) on annual data
In both cases, we rejected (with formal statistical confidence) the null hypothesis that the Dow is a Markov chain. The runs test indicated “too few” runs, meaning that the DJIA tends to have winning streaks (and losing streaks) that are more prevalent than randomness would indicate. The smoothness test indicated that the DJIA has a built-in smoothing mechanism that is clearly there but no one has ever, to our knowledge, explained.
Motivated by those findings, we searched for “winning” strategies versus the DJIA.
The team decided to investigate the following categories:
· doller cost averaging strategies including “generational luck”
· calendar-based strategies
· economic environment-related strategies
Conclusion
We are confident that we have found some strategies that “beat the market”, though not by much. IN all we investigated 122 strategies, and only a handful were outside of a very narrow range. Our metric was the inflation-adjusted internal rate of return.
Some of our conclusions were:
· Random strategies invariably generate nealy identical returns (6.74% real per year)
· Dollar cost averaging does NOT beat the market
· The idea that some calendar months are better than others is UNTRUE
· War is NOT good for the stock market
A strategy that does work: buy when the President is a Repbulican during peacetime when real wages have recently risen.
Faculty Mentor: Dr. Douglas Eckley
Graduate Mentor: Kibre Bekele
Researchers:
- Andrew Miller
- Benjamin Sarr
- Elaine Jin
- Emma A Burke
This semester, we focused on modern compiler optimization, a fundamental challenge in theoretical computer science.
In previous semesters, we studied Monte Carlo Markov chain (MCMC) sampling algorithms, like simulated annealing and parallel tempering, for stochastic search. These algorithms are good at searching large solution spaces, and can be re-cast as general, space-efficient optimization algorithms. This semester, we shifted our focus to STOKE, a stochastic superoptimizer that uses simulated annealing to optimize x86 assembly code. Because simulated annealing is more prone to being caught in local minima, and given the complex search space of x86 assembly code, parallel tempering may be better-suited to STOKE’s needs. We hope to determine whether replacing STOKE’s simulated annealing strategy with parallel tempering, can improve solution quality and reduce execution time. To support our hypothesis, we are making a mathematical approximation of the advances, explaining how we can improve the algorithm within STOKE’s engine.
Additionally, we continued work from previous semesters by developing tools for solving logic synthesis problems using parallel tempering. We have successfully replicated or exceeded existing optimization benchmarks with these tools and, with further improvements, may produce better results. These tools primarily consist of C++ code, scripts, and Python for analysis of results.
Looking forward, our research will continue to investigate and improve stochastic superoptimizers, extending parallel tempering methods to other domains of code optimization, and benchmarking and tuning our techniques (swap rates, temperature schedules, and replica counts) against standard datasets and real-world codebases.
Faculty Mentor: Dr. Michael Jarret
Graduate Mentor: Anthony Pizzimenti
Researchers:
- Eric Zipor
- Mark Dubynskyi
- Raghu Guggilam
- Safiuddeen S Salem
The motivation is to study population dynamics within habitat patches. This semester, we focused on steady state solutions of a non-linear RDE (Reaction Diffusion Equation) where the reaction term follows the Allee Growth Model. Through the method of reduction of order and analyzing the Hamiltonians functions derived from our piecewise definition, we established a framework that characterizes the behavior of populations within the habitat.
We formulated a theorem to prove the existence of a critical size of the habitat. To prove the theorem, we used analytical methods to satisfy conditions required for the existence of a habitat and for a critical size. Furthermore, we used the numerical method of pseudo-arclength continuation to evaluate the critical size and to overcome challenges that were present when using analytical methods.
Faculty Mentors: Dr. Emmanuel Fleurantin, Dr. Matt Holzer
Graduate Mentor: Julia Seay
Researchers:
- Enayah Rahman
- Ivan Chan
- Nicholas Maranto
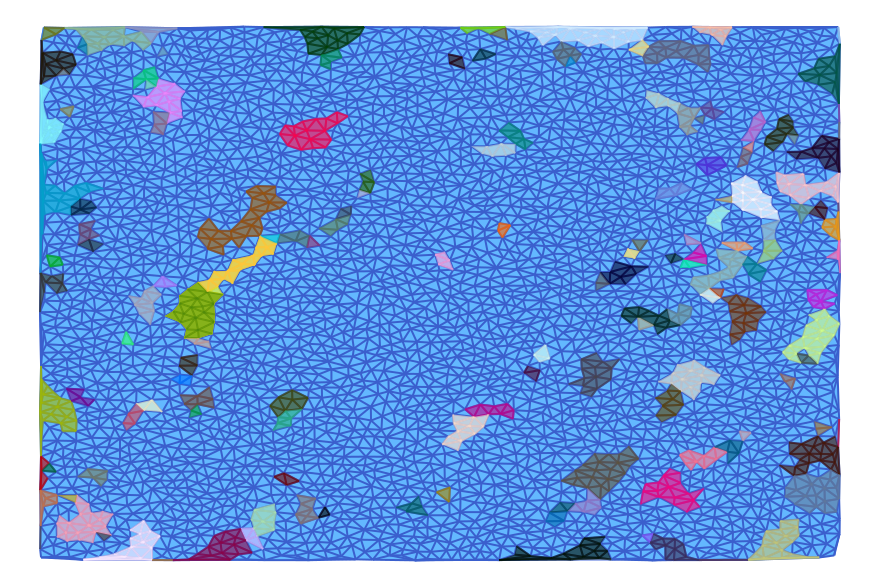
Prediction and planning are an integral part of the mitigation of natural disasters, and mathematical research is almost always at the forefront of this endeavor. Given basic geographic elevation data, we want to predict where floodwaters would go if a dam were to break using topological methods.
The approach is to take a height map of a region around a dam. Here we have a rectangular grid, where for each discrete point there is a corresponding elevation value. We then lay a triangulation over this grid and use the height data to construct a directed graph, which has rich topological properties. The dynamical transitions from a vertex or an edge into a triangle give us a way to examine the possible flow in a combinatorial setting.
There exists a decomposition of this graph into what we call multivectors – essentially a partition into components according to their “local” closure- and we identify the ones that display isolated invariance. These are known as Morse sets (analogous to the fixed points of a differential equation in our case), and the relative homology of each one gives us insight into its stability. Identification of the Morse sets and the intervals between them is achieved via computations in Dr. Wanner’s ConleyDynamics.jl package in Julia. This gives us an outer approximation for the paths of floodwater.
The biggest challenge so far has been in dealing with geospatial data; there is usually some level of distortion to account for when translating from the curved surface of the earth onto a flat rectangular grid, and it can be difficult to know how significant the distortion actually is. Despite this, we were able to produce morse sets roughly corresponding to the topography of Burke Lake.
Aside from testing our method on more diverse data, we are also planning to refine our algorithm for assigning direction to the graph, as well as to explore various methods of grid interpolation and noise reduction.
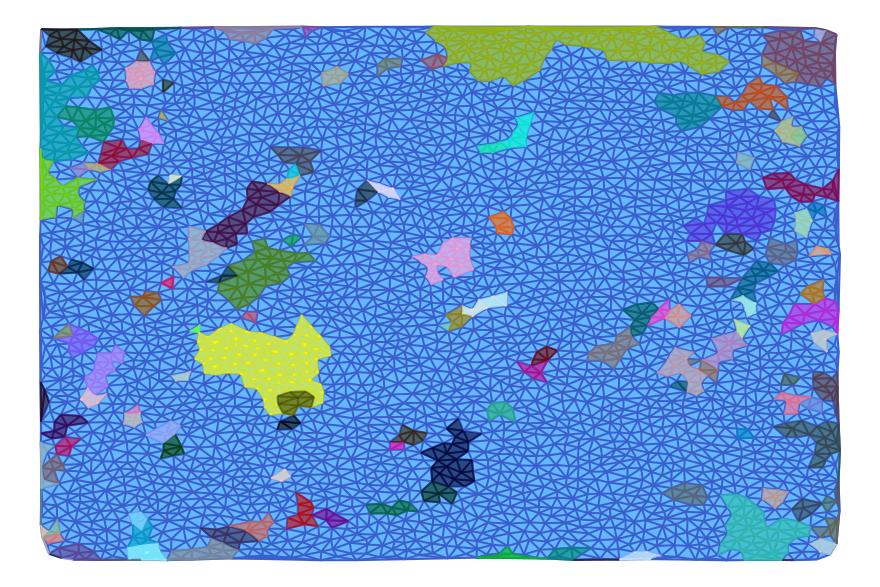
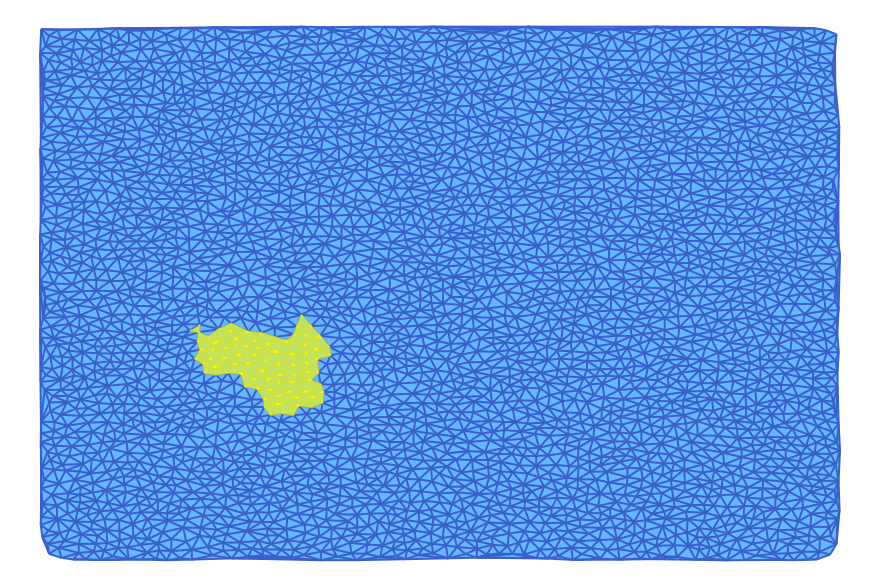
Attached images: Intervals between Morse sets (in bold yellow)
Figure 1: Morse interval shown in a finer triangulation.
Figure 2a: Morse interval shown in a coarse triangulation.
Figure 2b: Isolation of Morse sets and the interval between them (same color).
Faculty Mentor: Dr. Thomas Wanner, Dr. Evelyn Sander
Graduate Mentor: Frank Pryor
Researchers:
- Marty Roger
- Kyle Hess
- Will Carey
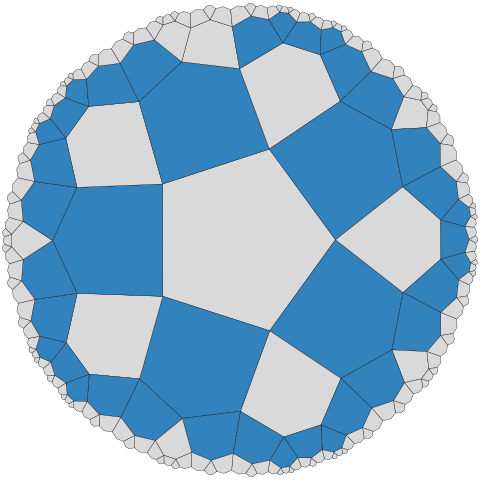
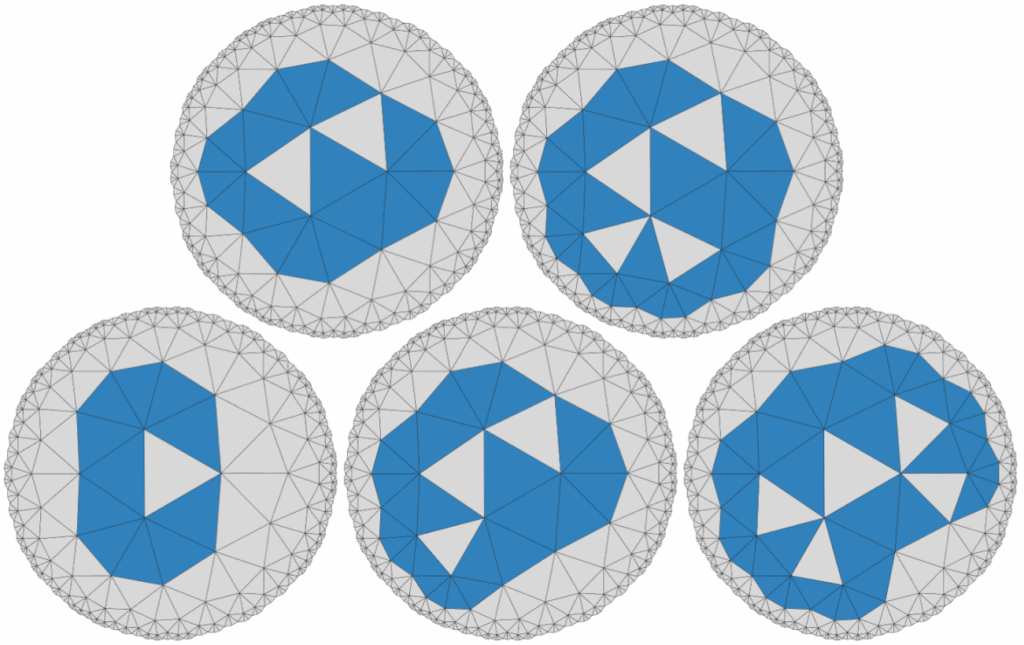
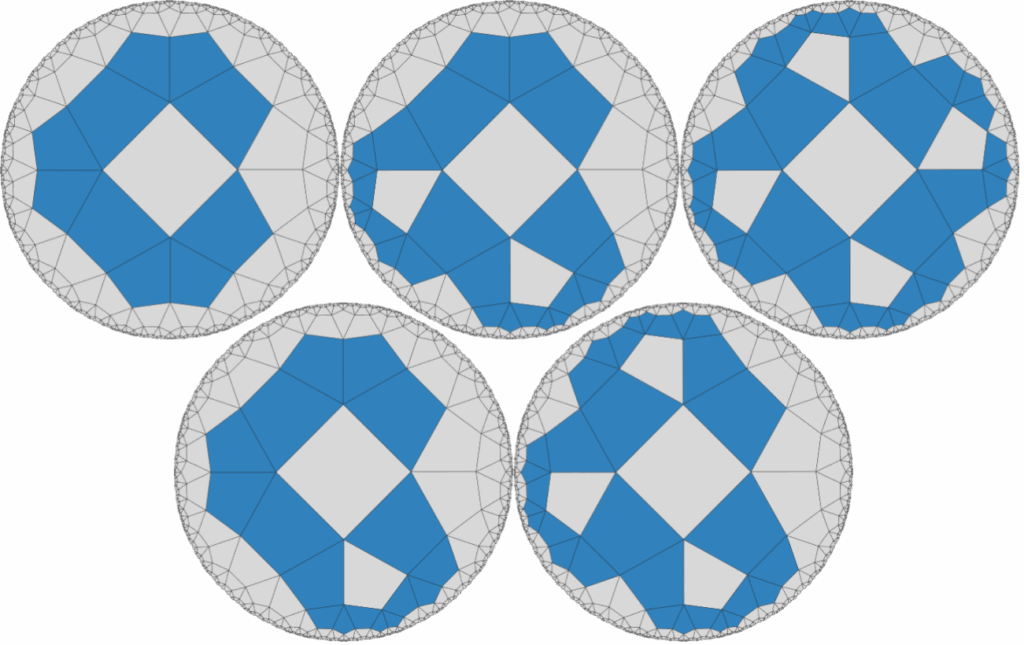
A polyform is a plane figure constructed by joining together identical basic polygons. In Euclidean geometry, there are only three types of regular polyforms: those made out of squares, triangles, or hexagons. In this project we explored regular hyperbolic polyforms, of which there are infinitely many types. These are constructed by joining together tiles of a regular hyperbolic {p, q} tessellation, which is a tiling of the plane where p is the number of sides each tile has and q is the number of tiles that meet at each vertex. To ensure these tessellations are hyperbolic, they must meet the condition (p − 2)(q − 2) > 4. In these polyforms, a hole is a bounded component of the complement of the polyform. We call a polyform crystallized if it has as few tiles as possible for its number of holes.
Our primary goal was to answer this question: Given a positive integer h, how many tiles does a crystallized polyform with h holes have? Additionally, we aimed to uncover additional properties of crystallized hyperbolic polyforms, to develop algebraic representations of polyforms, to find a way to effectively visualize hyperbolic polyforms with large numbers of tiles, and to create examples of crystallized hyperbolic polyforms.
Key Outcomes:
1. Theoretical Advances: We have established that if a polyform has no holes with area greater than one, has a dual graph that is acyclic, and the union of it and its holes has minimal outer perimeter, then it is crystallized. We have also shown that ß(p – 1 – [1/ß])h ≤ g(h) ≤ (pq – 2p)h, where ß is the plus solution to (p – 2)x^2 – (p – 2)(q – 2)x + (q – 2) = 0. Furthermore, we have shown that if the limit exists, lim(h->infinity) g(h)/h ≥ ß(p – 1 – [1/ß]). Finally, we have shown that in {2k, 3} tessellations, g(h) is equal to the minimum possible vertices of a {2k, k} polyform with h tiles.
2. Coding Developments: We have produced an algorithm using depth first search without backtracking to compute the minimum tiles for polyforms with a given number of holes across various tessellations. While effective for polyforms with relatively few tiles, the algorithm has O(p^n) time-complexity where n is the number of tiles in the resulting polyform, so it quickly becomes infeasible for larger polyforms.
3. Representations: We created a visualization tool in Java that allows the user to pan their view through a representation of the hyperbolic plane to see one small portion of a large polyform at a time (See https://github.com/CRoger20/megl-polyforms/). Additionally, we have created images depicting various polyforms using the python hypertiling project (https://doi.org/10.5281/zenodo.7559393), some of which can be seen above and below.
Acknowledgements
We thank our faculty mentors Dr. Ros Toala and Dr Erika Roldan, as well as our graduate mentor Summer Eldridge for their support and guidance. We also thank Dr. Peter Kagey for helping us better understand polyform enumeration and Malin Christersson for their website that creates interactive hyperbolic tessellations (https://www.malinc.se/noneuclidean/en/poincaretiling.php).
Faculty Mentors: Dr. Ros Toala, Dr. Erika Roldan
Graduate Mentor: Summer Eldridge
Researchers:
- Aiden Roger
- Cooper Roger
- Adithya Prabha
Percolation is a model of fluid flow through a random medium. Take an N x N square grid and randomly declare squares open, one at a time, until there is an open path from one side of the square to the other. It turns out that this path behaves like a fractal! The fractal properties of random paths in percolation have been of great interest in both mathematics and physics. Recently, researchers have introduced higher-dimensional versions of these models for which the objects of interest are random surfaces rather than random paths. In this project, we will perform computational experiments to investigate the geometry of these random surfaces, and to see whether they have fractal properties.
Faculty Mentor: Dr. Ben Schweinhart
Graduate Mentors: Anthony Pizzimenti and Morgan Schuman
Researchers:
- Benjamin Atelsek
- Gregory Maleski
- Jonathan Glidewell
- Tristan Napoliello
Faculty Mentor: Ros Toala
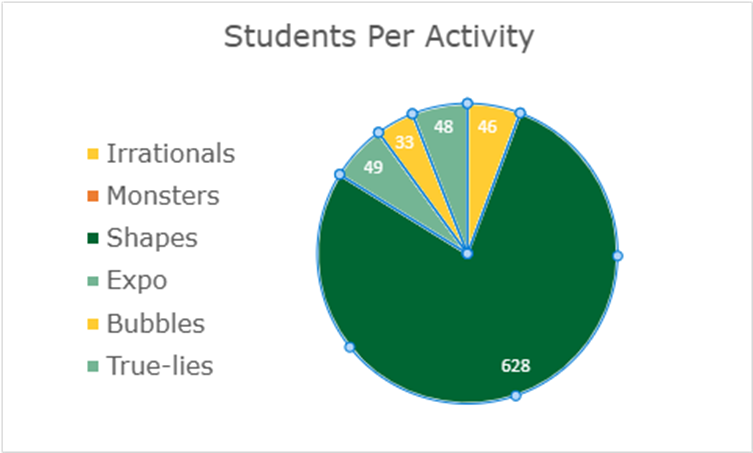
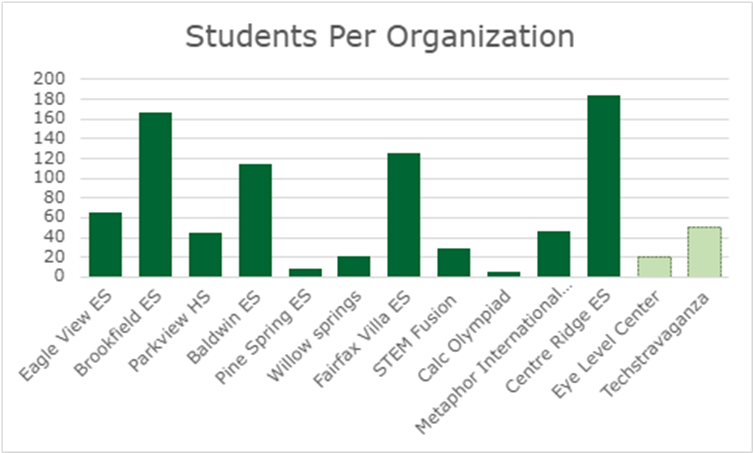
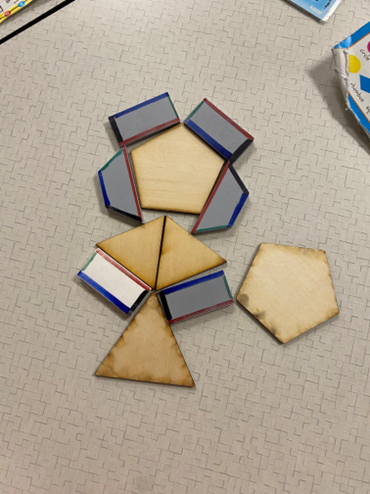
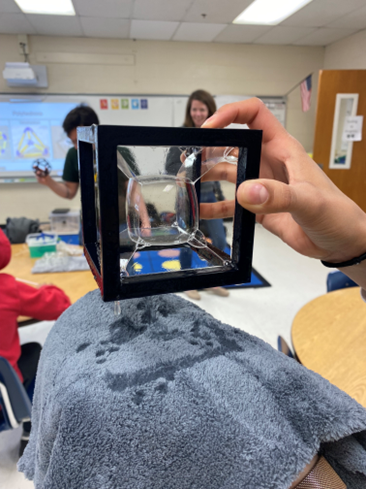
Description: This semester, we reached 804 students of all ages across 11 different organizations, delivered 42 sessions. We were able to run 4 activities, with our primary focus being on “The Shapes That Make Us” and “Living in a Math Bubble”. We also delivered sessions at the Metaphor International School, and presented at the TSA Regional Science Fair at Park View High School, STEM Fusion and Calculus Olympiad at GMU.
Graduate Assistant: Tim Banks
Undergraduate Interns:
- Oluwatomisin Badmus
- Mark Dubynskyi
- Khang Ly
- Joanne Romo