During Fall 2020 MEGL will run a 4 project program with 21 participants (faculty, graduate, and undergraduate students). The four research/visualization groups are titled:
- Mathematical modeling of capillary rise in porous materials
- Communication about the Science and Data of COVID-19
- Geometry of Machine Learning
- Visualizing Thurston geometries in VR
Additionally, there is one public engagement group which we refer to below as Outreach. The research/visualization groups engaged in experimental explorations involving faculty, graduate students, and undergraduates. Teams meet weekly to conduct experiments generating data, to make conjectures from data, and to work on theory resulting from conjectures. The outreach group involved faculty, graduate students, and undergraduates to develop and implement activities for elementary and high school students that were presented online to local schools and libraries. We will conclude with an end of term symposium and a poster session via Zoom.

Faculty Advisor: Dr. Daniel Anderson
Graduate research assistant: Jessica Masterson
Undergraduate research assistants:
- George Andrews
- Zachary Richey
- Matthew David Kearney
- Laura Nicholson
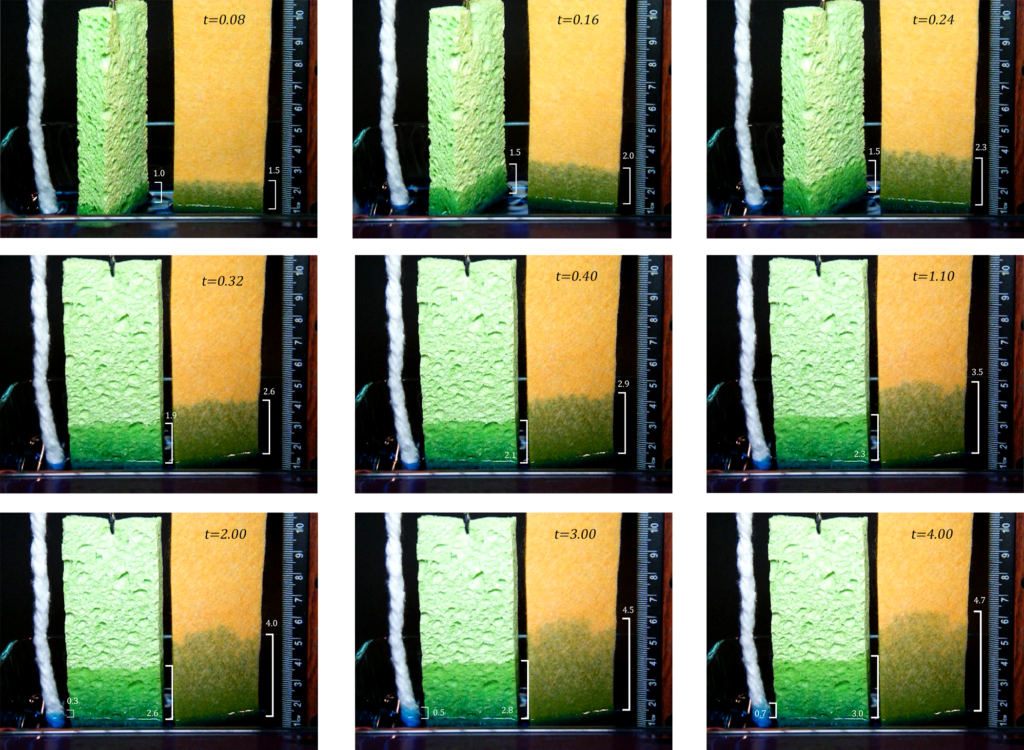
The phenomena of capillary rise of fluid in porous materials is central to many problems in fluid mechanics and has a broad range of applications. The goal of this project was to explore predictive mathematical models and compare results with published capillary rise data, as well as with data obtained from simple experiments using familiar porous materials.
In this project, we examined the Washburn equation and how it was derived from the Navier-Stokes equations. We removed the steady flow assumption from Washburn’s original analysis in the hopes of producing a more accurate model of fluid motion. For the special case of constant pressure gradient, we were successful in finding a closed equation for meniscus height as a function of time. For the nonconstant case, we have found a set of differential equations that describes the system.
We have also experimented with analytical and numerical solutions to capillary rise problems in a variety of environments. Some examples include fluid rising between two plates, in the hole of a torus, and in regular packings of spheres. We hope to use these findings to develop a more accurate mathematical model of the structure of porous materials. Additionally, we have conducted real-life experiments using a variety of fluids and porous media, in order to compare our observations with the established literature, as well as our own predictions. This project will be continued into the Spring 2021 semester.
Downloads:
Faculty Advisor: Dr. Rebecca Goldin
Graduate research assistant: Joseph Frias
Undergraduate research assistants:
- Justin Rosenberg
- Victor Guzman Duran
- Ghaaliyah Brown
For most of the general public, the media serves as the primary source of information. The COVID-19 pandemic provides no exception. As such, the manner in which scientific concepts are communicated by media outlets can have a significant impact. In this project, we identified several mathematical concepts that were generally misunderstood by the media and set out to develop visual techniques to clarify what should have been communicated.
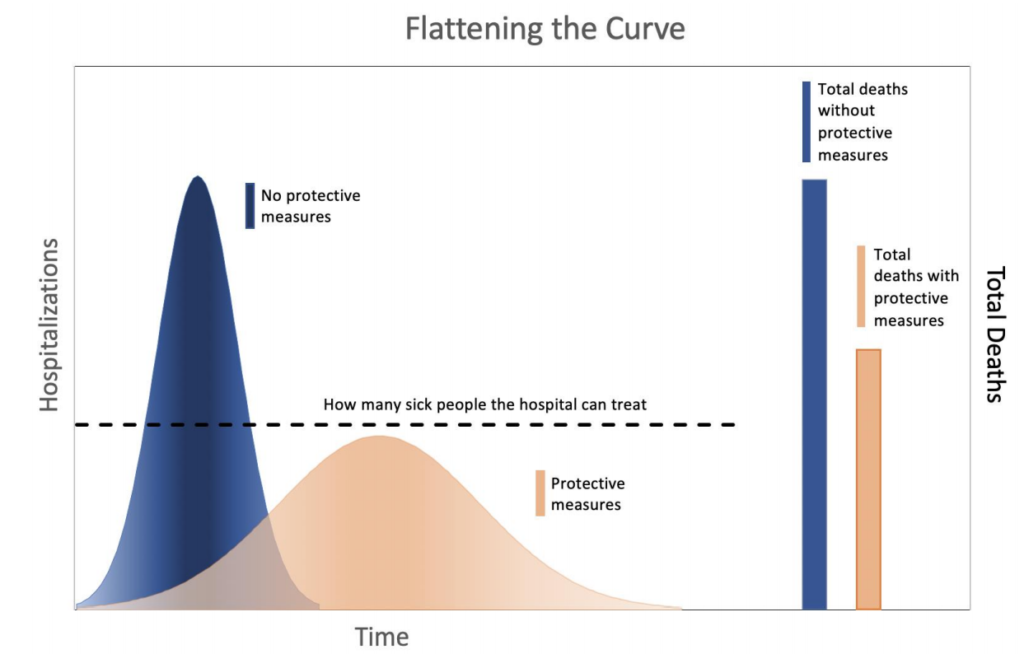
One concept that was prevalent in scientific communication regarding COVID-19 was that of flattening the curve. There were many different graphics circulated that were meant to communicate this idea, but the basic framework of all of them was the same. The main problems identified in these graphics are as follows. While they communicated well the idea that flattening the curve results in less cases at any one given time, they did not indicate why a flatter curve was beneficial beyond that. To address this issue, the graphic was modified to include a secondary y-axis against which bars representing total death were graphed. The other main issue addressed was that the original graphic related infection at any one time to hospital load. However, not every infection results in hospitalization, so there is no direct relationship between these two parameters. To fix this issue, the primary y-axis was changed to hospitalizations.

Another project that we set out to study was the concept of the “peak phenomena” and what this meant to the public. We worked with a three-step model process which included: researching independent data to use in graphs, visualizing the data, and finally selecting the correct software to help show this “peak phenomena”. Part of the challenge of this project was having to choose certain design elements that could portray the data in a clear manner. We were able to accomplish this using the bar charts for the raw daily data and a trendline that was the moving average of weekly COVID cases. The animation that we finalized on was able to show the three peaks that Idaho has been through with a dynamic y-axis which creates a sort of zooming out effect. This is for audience engagement and to drive home the point that the media should not be quick to label a timeframe as the “peak” as this could be misleading to the public. Tableau alone was not the only software we used but also Microsoft PowerPoint and a video recording software to create the animation that we set out to create.
Downloads:
Faculty Advisor: Dr. Matt Holzer
Graduate research assistant: Jessica Masterson
Undergraduate research assistants:
- Colin Arnett
- Shrunal Pothagoni
- Justin Cox
This is an exploratory project aimed at understanding how neural networks operate. We will read some papers and try to construct simple examples that illustrate how these networks work as classifiers to separate data into two or more groups. The project will involve both theory and numerical implementation. Interested students should be willing to be involved in both aspects of the project.
Downloads:
Faculty Advisor: Dr. Anton Lukyanenko
Graduate research assistant: Joseph Frias
Undergraduate research assistants:
- Jean-Marc Daviau-Williams
- Samuel Wells
- Aidan Donahue
- Taylor Fountain

This semester we were focused on continuing our exploration of Thurston geometries using our previous arrow simulation. We successfully added the half-space model of hyperbolic space into our simulation and a multiplayer component to the game. We did this by deriving the geodesics of the half-space model by utilizing the group of isometries to transform the simplest geodesic in the space. From there we found an equation for the position of an arrow given its initial position and direction, which we implemented into the simulation.

Tangential to our exploration of hyperbolic space, we also created visualizations of Ford spheres, which act as a representation of certain complex rational number fields. We used a paper “Ford Circles and Spheres” by Sam Northshield to give us a systematic way of constructing these spheres in Mathematica. We then visualized these configurations in Unity, and showcased two of them in a Youtube video.
Downloads:
Faculty Advisor: Dr. Harrison Bray
Undergraduate research assistants:
- Susan Tarabulsi
- Aidan Donahue

This is the first semester we fully operated online. We were successfully able to overcome the challenges of virtual learning to engage students and get them excited about math. It is our second semester of having an outreach team and we welcomed our new outreach director, Dr. Bray.
Our main focus this semester was to get in contact with schools and continue our work from last semester by converting activities online, as well as refining them in the process. This process included collaboration with George Mason’s local chapter of the Association for Women in Mathematics. Now, all five of our in-person activities have an online version. We plan on creating a new activity next semester with both in-person and online formats. We also anticipate reaching more students, especially those in secondary school.
Downloads:
